Ontario Teachers' Pension Plan (OTPP)
2024
Used data insights to drive UX improvements: boosting self-service by 15%


Data-informed enhancements to the retirement journey
Data sources
Quantitative and qualitative data sources
To understand where and why the digital experience was breaking down for members during this milestone interaction, I drew on several key data sources:
Key data sources
Google Analytics
Abandonment patterns
Genesys call centre data
Call volumes
Contact centre staff
Call reasons
Web intercept survey
Direct user feedback
Google Analytics showed us where members were dropping off, while Genesys call centre data gave us call volumes per topic. But call data had limitations. A topic was subjectively assigned to each call by contact centre staff, and members often called about more than one issue at a time. To get richer insight, the UX team also listened to some recorded calls.
Contact centre staff filled in the gaps I couldn't get from data alone. I interviewed staff, attended their team meetings, and embedded representatives in the project as SMEs. They revealed the anxiety behind the numbers: the recurring questions members had, and the moments when they lost confidence and reached for the phone.
A web intercept survey gave us direct feedback from members mid-experience, capturing frustration and confusion in their own words.
Together, these sources let us prioritize with confidence, focusing on the moments most likely to break trust or trigger a call, and establish the project's success metrics.
Success metrics
Digital containment
Increase % of self-serve journeys
Inbound calls
Reduce calls for assistance
Internal effort per application
Streamline workflows
Member logins
Increase use of self-serve portal
Problem area
Understanding who we were designing for
Retiring teachers are, on average, 59 years old and have been teaching for two decades or more. While excited to retire, they're often uncertain about what to expect. They intend to apply online, but the irrevocable decisions the application requires leave many feeling they need support. Beyond a form to fill out, they want transparency and reassurance.
This came through consistently in what contact centre staff shared and what members told us directly: a lack of visibility and confidence at key moments was leading members to leave the digital channel.
After analyzing both quantitative and qualitative data, we prioritized four key problems to address:
High application abandonment
Uncertainty about application status
Manual document follow-up
Anxiety during the waiting period
Solutions 01
Reducing application abandonment
Analytics showed members were often abandoning the application at the first step but completing it successfully on a later attempt, suggesting they were arriving unprepared. We added a checklist directly before the first step, reducing drop-off and the need to restart.

Checklist added before the start of the application
Solutions 02
Improving application status visibility
Members who applied online were frequently calling in for updates. We added progress trackers to the pension application and document uploader, and introduced status emails at each stage of the review process, giving members visibility without needing to call.

Progress tracker showing application status across three stages
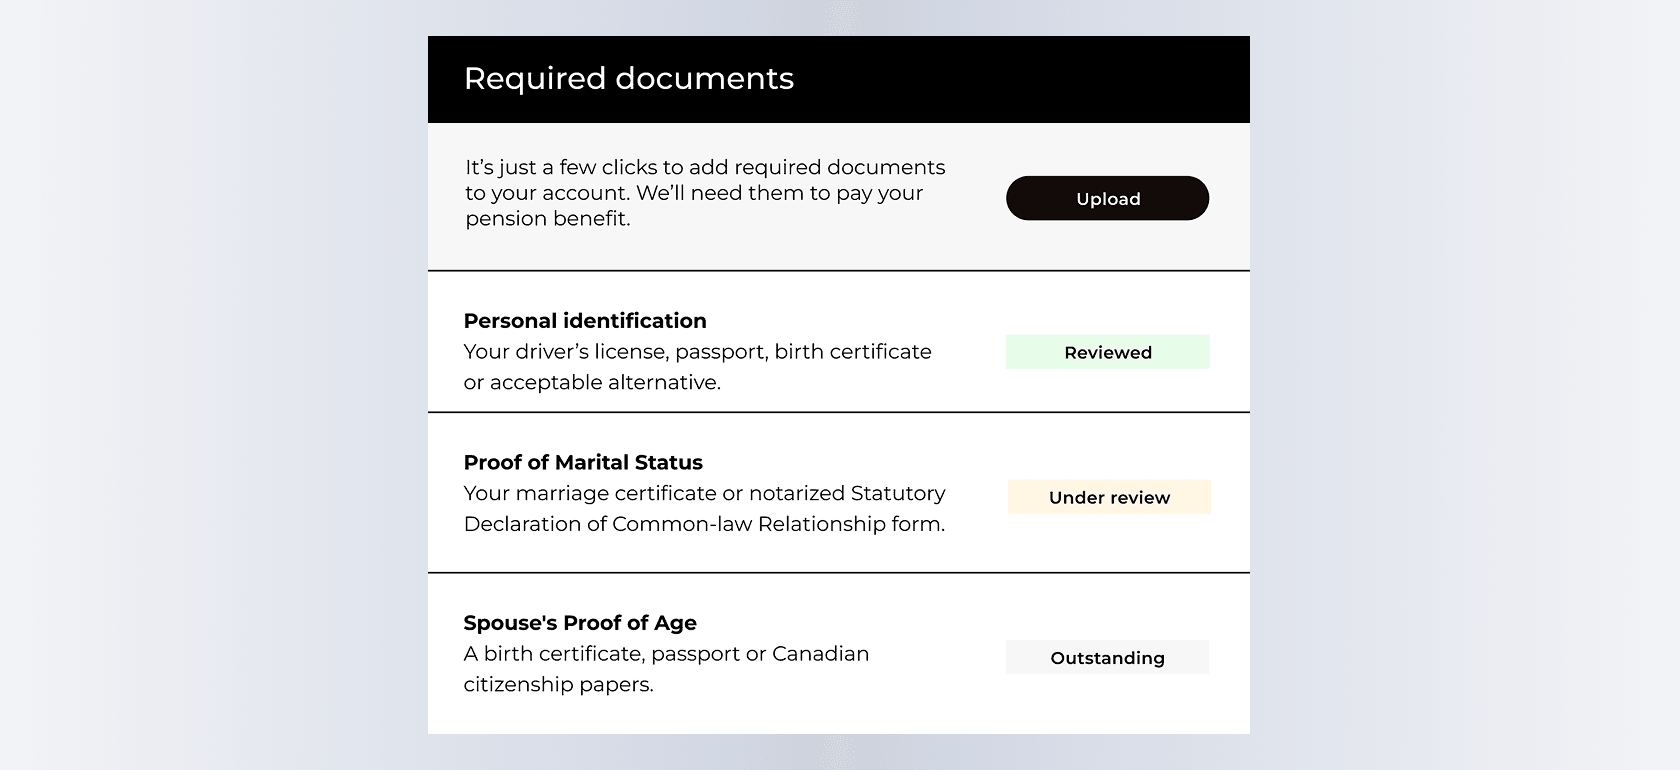
Status indicators for documents outstanding, under review, or reviewed
Solutions 03
Staff were frequently emailing members about missing documents and managing the replies, a time-consuming process that also slowed approvals. We replaced it with automated reminders triggered by document status, prompting members to upload what was needed without staff intervention.

Emails triggered by member actions and application status changes
Solutions 04
Easing anxiety during the waiting period
After approval, members faced a waiting period before their first pension payment, prompting many to call for reassurance. We launched an educational email series that proactively answered the questions members were calling about.
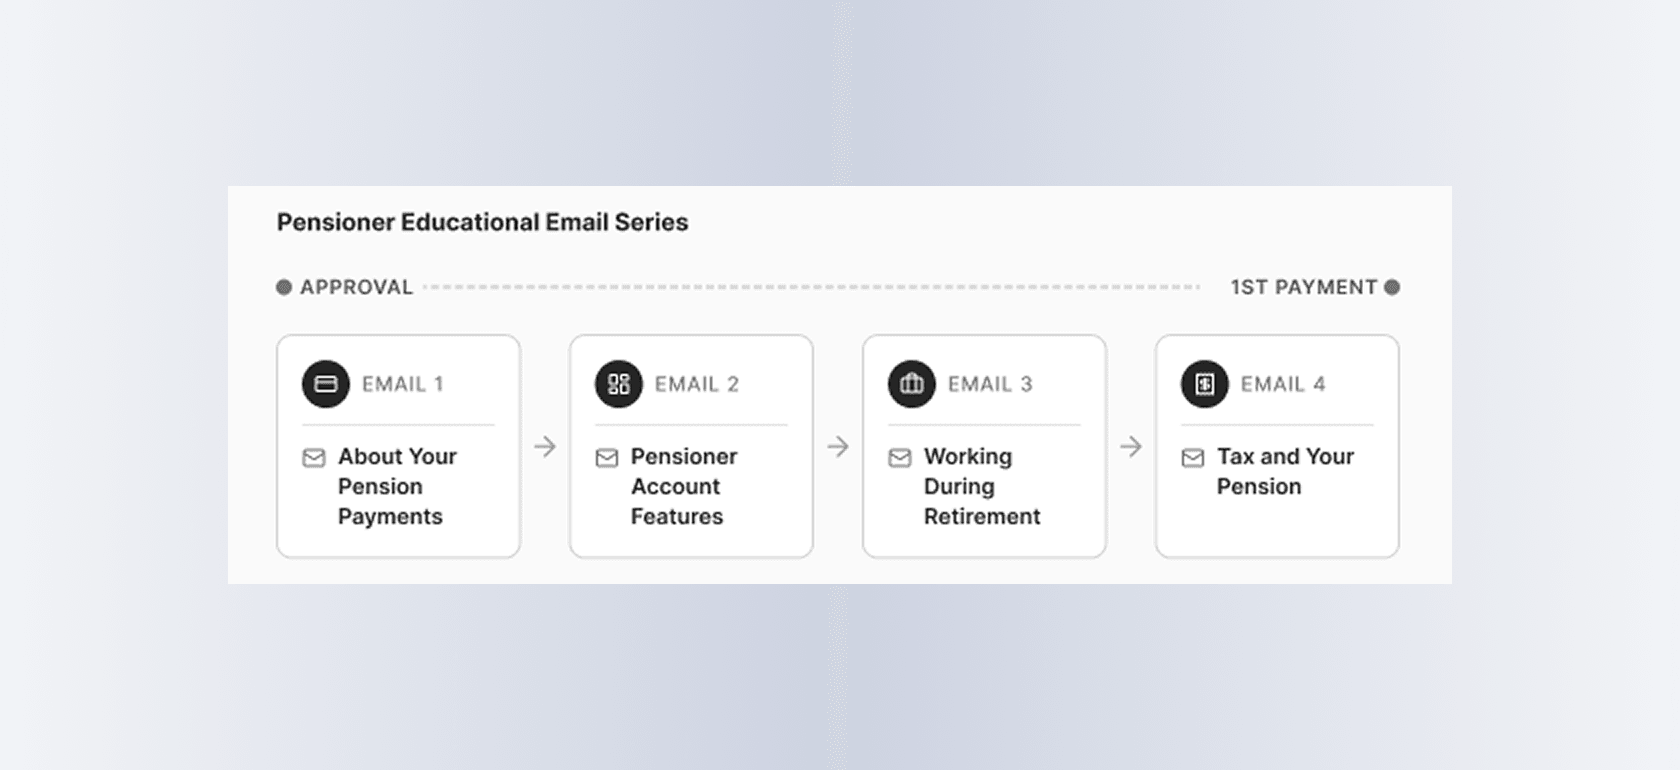
Emails distributed evenly between pension approval and first payment dates
Retrospective
Results
38% of retiring members completed their journey entirely within the self-serve digital channel during the retirement season following launch, up from 33% the year before.
+15% Digital containment
Status transparency helped increase member confidence in self-service
−28% Inbound calls
Triggered emails and trackers reduced reassurance-seeking
−23% Internal effort per application
Automated reminders replaced manual document follow-up
+74% Member logins
Emails drove engagement with digital tools and content

Digital containment % from 2020-2025
Why data foundations mattered
Bringing the Insights & Data team in at the start was key to my approach. They helped us make sense of historical trends and project the potential impact of each feature we considered, from increased digital containment to reduced call volume, so we could prioritize the ones with the highest potential impact. The team also built Power BI dashboards combining Google Analytics data (application starts, completions, and portal logins) with Genesys call data (which members called, and how often), helping us visualize impact and report credibly on outcomes after retirement season closed.
This initiative delivered the largest single-year increase in digital containment on record, with lasting impact on both member experience and operational efficiency.